Index

Chapter 9. Trade Liberalization and Rural Revitalization: A Systems Dynamics Model for Iitate Village, Japan
Eiichi Kusano, Mitsuhiro Nakagawa and Leonard Apedaile
Objective
This study investigates strategies that could revitalize less favoured rural economies highly exposed to the global economy. Trade liberalization for commodities intensifies the rural development challenge for OECD countries, such as depopulation, aging and economic stagnation. Iitate Village in Fukushima Prefecture is typical of such rural economies facing these challenges. A System Dynamics Model (SD model) is used to investigate effects of alternative rural revitalization strategies for Iitate. Effects are evaluated by estimated changes in the rate of depopulation and income per worker compared to a baseline case.
Globalization is about access to and intrusion by new technology and ways of organizing business and knowledge. Liberalization is about trade. Lower input and output prices are first and foremost a trade issue. Thus, as border measures are reduced, the Iitate economy is exposed to lower priced foreign suppliers in both input and output markets, especially for raw materials (granite), electronics and clothing from China at this point in history. The migration of manufacturing offshore is primarily a globalization effect as value-adding moves organizationally to cheaper arrangements, whether because of lower wages and benefits, lower social charges or weaker regulations for the environment and transport safety.
An overview of Iitate Village
Iitate Village is located in the North Eastern part of Fukushima Prefecture, Japan. The village is located in the highlands at an altitude of about 200 m. It covers about 230 km2, of which forest accounts for 75%. The village population was 7,012 and its GDP was 15.9 billion yen in 2001 (see Appendix 2). Figure 1 illustrates the trends for total population and GDP in Iitate Village.
During the mid eighties, Iitate Village developed a long term municipal government strategy to combat declining incomes and population. A direct marketing and trade-marking strategy was devised. The ‘Iitate Meat Bank’ was established in 1985 and the ‘Iitate Cooperative for Development’ in 1988. The beef brand was ‘Iitate Beef’. The direct delivery system extended beyond Fukushima into the greater Tokyo metropolitan market. By the early 1990s, the development bubble had burst along with the high incomes upon which the trade-marking strategy depended for extracting rents from the market. The municipal government responded by adding a tourism component in 1994, establishing a village inn ‘Kikori’ and a steakhouse (Takahashi et al., 2000). A special treatment nursing home for aged people was added in 1997 (Iitate Social Welfare Councils, 2002). However, the village population, which had peaked at 11,403 in 1956, continued to decrease. In recent years the population has been declining by about 100 persons every year.
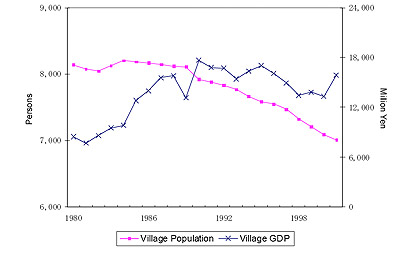
Source. Department of Statistical Analysis, Faculty of Project Planning & Development, Fukushima Prefecture
The GDP of Iitate Village increased favorably in the 1980s, then stagnated during the 1990s and began to decrease in 1996. The GDP of the primary industry sector has stagnated at about \2,000 million since the late eighties. At the same time, the share of GDP contributed by the manufacturing sector increased rapidly reaching its peak at \8,700 million in 1990, then followed the primary sector down, decreasing to \4,300 million in 2001. The GDP of the service sector fared better, increasing gently to \7,300 million in 1995, then decreased to \5,700 million in 1998 but increased again to \9,600 million in 2001.
Japan’s bubble economy burst in 1990 and the BSE disturbance in 2001 pulled down prices for livestock products. Offshore competition with Iitate highland vegetables, flowers and stone products increased with the higher Yen/Dollar exchange rate. The shrinking labor force was also a major factor in the decline of GDP for Iitate Village.
Figure 2 shows the change of worker’s income. It declined for every sector in recent years compared with the mid-1990s. Annual per worker income in the primary industry sector is relatively low at about \2 million mainly due to high engagement rate of aged workers. Per worker income in the service sector is relatively high mainly due to the national income standards for public officials and school teachers.
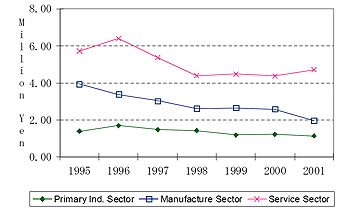
Sources. Department of Statistical Analysis, Faculty of Project Planning & Development, Fukushima Prefecture; Statistics Bureau, Ministry of Internal Affairs and Communications (1996, 2001)
The SD model analysis
Basic structure of the SD model
The purpose of the model is to evaluate effects of rural revitalization strategies on workers’ incomes and depopulation. Therefore these variables are made endogenous to the SD model. It is anticipated that prices of input and output will decrease with trade liberalization, so prices are exogenous.
Figure 3 describes the flowchart of the SD model, consisting of three sub models: a population sub model, an industry sub model, and a public sector sub model. The population sub model predicts village population by age using a cohort model. The industry sub model consists of three sectors, including primary industry, manufacturing and services.
The value added by each sector is determined by the capital, the number of workers and the prices of outputs and inputs translated through a Cobb-Douglas type production function. The production function is used to predict per worker income and the number of workers. The public sector sub model predicts public investments according to village tax revenue and subsidies from the national and prefectural governments. Public investment influences output levels for each industry sector. Major parameters of the SD model were estimated by applying regression analysis to historical statistical data (Kusano, Nakagawa & Apedaile, 2005).
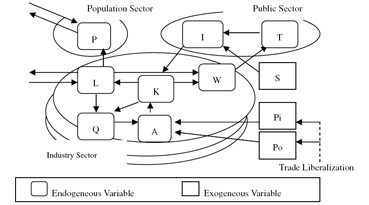
P: Total Population, L: Labor Force, K: Capital, W: Wage, T: Tax, Q: Production,
A: Value Added, Pi: Input Price, Po: Output Price, S: Subsidy
Sensitivity analysis
Table 1 shows the results of the sensitivity analysis using the SD model. Changes in endogenous variables, such as per worker income and total population in 2010 are compared to those in the 2001 baseline case. The exogenous variables of output price, input price, village tax rate, subsidy to municipal government and the public investment rate are assumed to increase by 10%, 20% and 30% respectively from 2001 to 2010.
Table 1 indicates that change in output price has the most impact on changes in per worker’s income and on total population. The second most influential exogenous variable is input price, while impacts of village tax rate and government subsidies to the municipal government are negligible.
| Increased Rate (%) | ||||
| Exogenous Variable | Engogenous Variable | 10% | 20% | 30% |
| Output Price | Worker's Income | 17.46 | 62.66 | 182.52 |
| Total Population | 3.32 | 7.99 | 14.48 | |
| Input Price | Worker's Income | -2.90 | -4.53 | -5.49 |
| Total Population | -0.81 | -1.49 | -1.99 | |
| Village Tax | Worker's Income | 0.01 | 0.01 | 0.02 |
| Total Population | 0.01 | 0.01 | 0.02 | |
| Subsidy to Municipal Government |
Worker's Income | 0.01 | 0.03 | 0.04 |
| Total Population | 0.01 | 0.02 | 0.03 | |
| Public Investment | Worker's Income | 0.03 | 0.06 | 0.09 |
| Total Population | 0.03 | 0.05 | 0.08 | |
Simulation scenario
The sensitivity analysis confirms the SD model works well for purposes of simulation. The effects of public or private investment strategies on rural revitalization strategies were simulated for the period from 2001 to 2010 using several scenarios.
Baseline scenario
Prices of output and input were assumed to decrease annually by 0.42% based on the annual rate for the period 1998 to 2001. The subsidy from higher levels of government to the municipal government was assumed to decrease by 2.07% annually, the actual rate for the same period. The allocations of public investment were set at \482 million for the primary industry sector, and \530 million each for the manufacturing and service sectors (Department of Statistical Analysis, 2001).
Public investment scenario
Case 2-1: Public investment for the primary industry sector was assumed to increase by \50 million every year.
Case 2-2: Public investment for the manufacturing sector was assumed to increase by \50 million every year.
Case 2-3: Public investment for the service sector was assumed to increase by \50 million every year.
Financing for public investment is assumed to come from the higher level of government subsidies to the municipal government. Therefore, the village tax rate is assumed to be constant. Compared to private investment, this level of public investment is relatively small due to the financial constraint imposed by the national government.
Private investment scenario
A common feature of revitalization is to try to harness the private sector. A conventional strategy is to try to attract new private investment to expand existing plant size or to establish new businesses. This possibility is always interesting despite the fact that it is losing some of its appeal because of its experience with costly concessions, the footloose nature of outside investment and the tendency to utilize low skilled jobs.
Whereas economic gardening to develop rural entrepreneurial initiative is gaining interest in the United States, pump priming subsidies and grants are standard policy in Canada and Japan. Two kinds of pump priming are used in Japan; one is subsidies to private investment, and the other is direct government or municipal investment. Both are carried out in Iitate. The Kikori Inn, Iitate Corporation for Development and special treatment nursing home referred to earlier are examples of municipal investment. The model treats these strategies as public investment.
The following case is for private investment:
- Case 3-1: Private investment for the primary industry sector was assumed to increase by \100 million every year.
- Case 3-2: Private investment for the manufacturing sector was assumed to increase by \100 million every year.
- Case 3-3: Private investment for the service sector was assumed to increase by \100 million every year.
Simulation results and implications
Table 2 shows the results of the simulation analyses. The base year value for per worker income was \2.29 million. The village population was 7,012. The simulation period is 2001 to 2010. The results demonstrate the revitalization problem with interesting options to improve the long term outcome for Iitate Village.
| Case | Per Worker's Income Million Yen |
Village Total Population Persons |
|
| Baseline Scenario | 1-1 | 226 | 6,331 |
| Public Investment Scenario |
2-1 | 226 | 6,345 |
| 2-2 | 227 | 6,361 | |
| 2-2 | 236 | 6,382 | |
| Private Investment Scenario |
3-1 | 227 | 6,388 |
| 3-2 | 228 | 6,391 | |
| 3-3 | 247 | 6,434 |
Baseline prediction
The baseline case where nothing is changed predicts that workers’ annual income would decrease to 2.26 million and total population would decrease to 6,331 by 2010. Therefore it may be expected that with continuing pressure of trade liberalization transmitted through lower input and output prices, workers’ incomes would continue the decline that begun in the early 1990s. The population of Iitate village may also be expected to continue its decline.
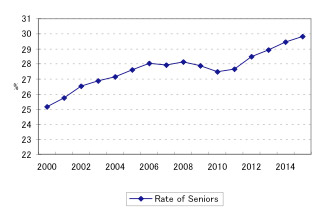
Figure 4 shows the population will continue to age. The proportion of seniors, those aged 65 or older, would continue to increase to 2010 from 25.2% in 2000 if it were not for the baby boomers. Beyond 2010 the proportion will resume its increase to 29.8% by 2015. The SD model predicts that in the absence of corrective policies, the population aging problem will become more serious in Iitate Village.
Counter strategies to trade-induced price decline
Both workers’ income and total population will be lower as output prices decline compared to the base year (see Table 1). A strategic effort to maintain output prices by product development is indicated to be a very important option. For example, product differentiation for agricultural and horticultural products based on the cool highland climate, could generate added value. Table 1 also indicates that any effort to reduce input prices could have a powerful effect on the local economy. These results suggest that efforts to develop both input and output markets would be an essential co-requisite to a product development strategy.
Revitalization strategy through public or private investment
The results shown in Table 1 also indicate that increasing the village taxes has no influence on rural revitalization. The reasons are structural. Village tax revenues account for less than 10% of municipal revenue (see Figure 5). Increased subsidies from the national and prefectural governments would have a slight influence on the village economy. We should not expect success in revitalizing the village economy through public investment alone. However the municipality is often required to be a co-investor in private projects so as to receive subsidies from higher levels of government.
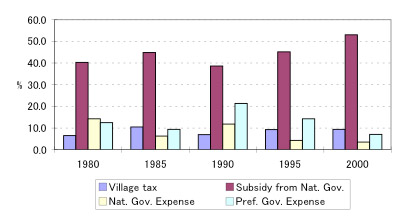
Source. Department of Statistical Analysis, Faculty of Project Planning & Development, Fukushima Prefecture
The simulation results for the public investment scenarios in Table 2 indicate that the best public investment strategy to increase per worker’s income to reduce the rate of depopulation should target the service sector. For example, it would be useful to expand the special treatment nursing home and receive more aged people into the village from other places, essentially a service export strategy. The development of service business for aged people, known as the silver industry, could revitalize the service sector, raise per worker’s income and expand job opportunities efficiently in Iitate Village.
Table 2 also indicates that private investment has the most impact on rural revitalization. An economic gardening regime to develop rural entrepreneurial initiatives and the pump priming subsidies and grants to new up and coming enterprises might be useful to revitalize village economy.
Interpretation and conclusion
The SD results say that in output weighted terms, rural revitalization requires economic restructuring and attention to price reducing transaction costs, such as agency fees. Public investment could be targeted to relieve rural entrepreneurs of some of the social costs of aging, to clean up the environment, to make roads safer, or to enforce brand integrity for example.
The interesting result of the SD simulation is the insignificant impact of tax rates and public administration subsidies on vitality. This result suggests that the governance aspect of revitalization remains to be modeled. Institutional and power balancing issues would be hard to model with the SD approach. Obviously development functions of local government are not part of the model. It could be argued that local government plays such a large role in the Iitate economy that, other than the payroll effect, public initiatives are in over-supply and could be reduced. Tax relief and income transfers to offset greater exposure to global markets and technology are popular instruments in higher taxed rural economies in some OECD countries, such as Canada.
References
- Department of Statistical Analysis. Faculty of Project Planning & Development. (1982-2004 each year). “Fukushima Prefecture Statistical Yearbook”, Fukushima: Fukushima Statistical Association. Vols. 96-118.
- Iitate Social Welfare Councils (2002). “Chaimu”, Fukushima: Iitate Social Welfare Councils. 6.
- Kusano, E., Nakagawa, M. & Apedaile, L. P. (2005). “Development of SD model for Evaluating Rural Revitalization Strategy: A Case Study of Iitate Village in Fukushima Prefecture”, Tokyo: Agriculture and Green Research Institute.
- Statistics Bureau, Ministry of Internal Affairs and Communications. (1996). “National Census Report 1995”, Tokyo: Japan Statistical Association.
- Statistics Bureau, Ministry of Internal Affairs and Communications. (2001). “National Census Report 2000”, Tokyo: Japan Statistical Association.
- Takahashi, K., Nakagawa, M., Nagasawa, A., Kumon, Y. & Kawade, I. (2000). “Revitalization and Landscape Protection in Rural Mountainous Area: A Case Study of Iitate Village in Fukushima Prefecture with GIS”, ‘Protection and Revitalization of Rural Mountainous Area in Japan’, Tokyo: Agriculture and Green Research Institute.